
FY26 highlights
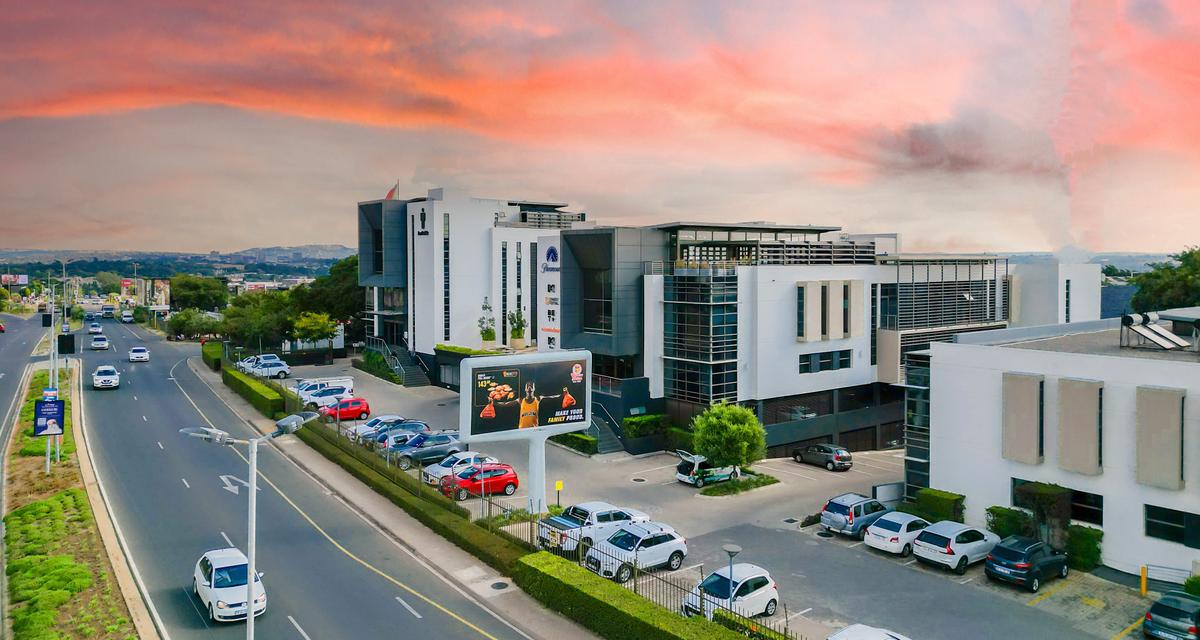
Our diversified business model provides resilience in an increasingly volatile global environment, underpinned by a robust real estate platform, diversified asset classes, broad geographic exposure, recurring fee income streams and multiple sources of capital.


FY26 highlights


Overall Group performance
Full year distributable income per share (“DIPS”) increased by 2.2% to 104.71cps (FY25: 102.47cps)
Dividend payout ratio maintained at 90% – full year dividend per share (“DPS”) also increased by 2.2% to 94.24cps (FY25: 92.22cps)
Stable underlying real estate performance across a diversified investment base providing a robust underpin to Group earnings
Secured R4.4 billion of new third-party equity commitments, creating capacity to deploy into c. R10 billion – c. R12 billion of real estate
opportunities, accelerating both real estate earnings and fee income:
Launched a European light industrial (“ELI”) platform alongside Hines with €130 million (R2.5 billion) of third-party equity committed
Equity commitment doubled from existing partners in Australian industrial platforms
The Group’s balance sheet remains sound with a LTV at 39.6% and reduced all-in cost of funding
Significant reduction in Group overheads by 17.3% with continued focus on integration efficiencies and fit-for-purpose cost base
Strong positive momentum going into FY27

Looking for a previous year?
Information on our prior results announcements and reports can be found here
View financial results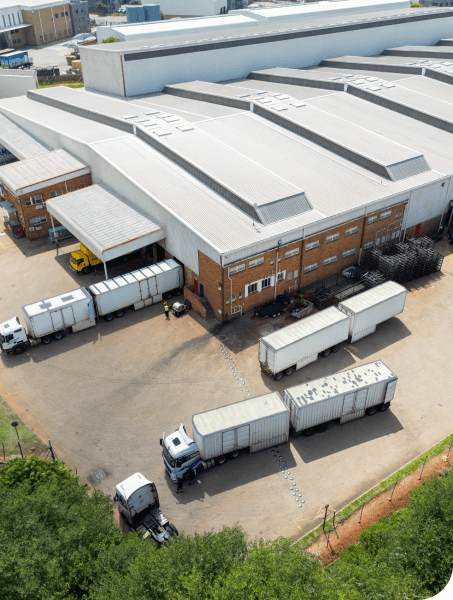


For investor relations queries
We need a few details and we’ll get back to you soon.